Making Observability Signal the Handoff Artifact Between Monitoring and Shipping
Structured trace evidence turns production failures into verified fixes.
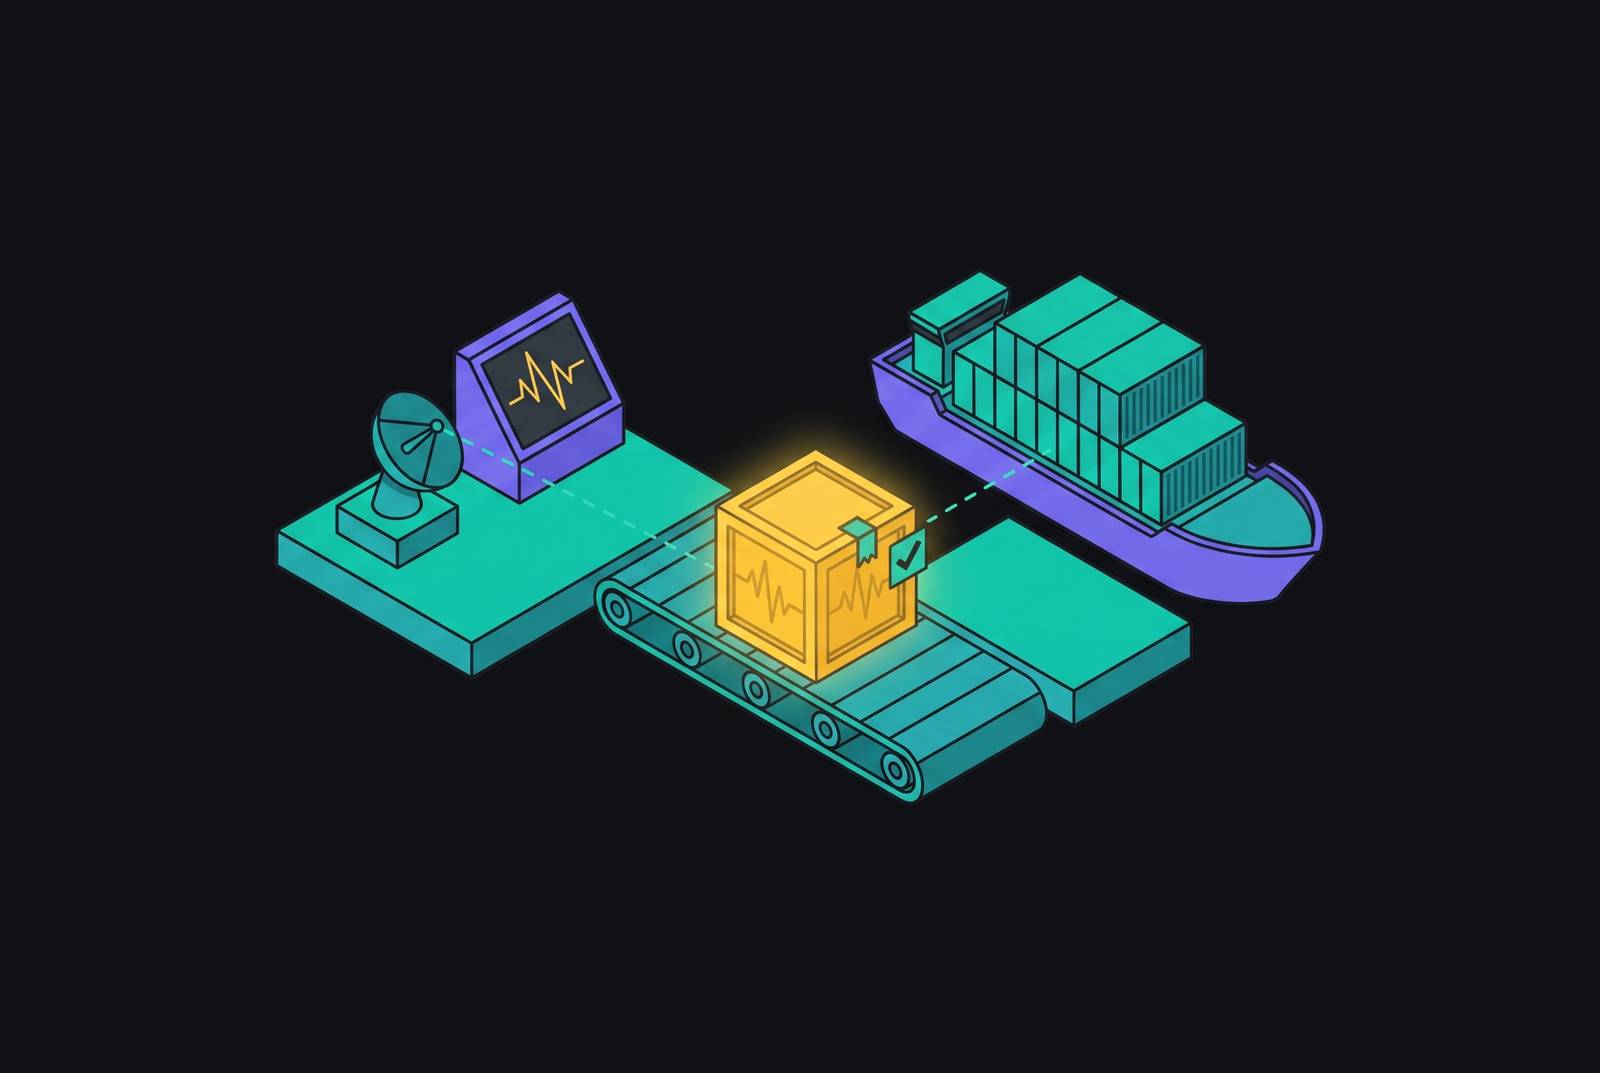
Production agent observability becomes a compounding improvement loop when traces travel from monitoring into the ship decision as structured evidence. That evidence must link a failure that was found to the harness layer that caused it, the proposed change, and replay results scored against historical behavior. The handoff artifact turns a production incident into both a verifiable fix and an evaluation case that guards future releases.
Why observability signal stops short of the ship decision today
An agent can call the wrong tool on every request since launch, return HTTP 200 each time, and generate no alert. The service looks healthy while the behavior is wrong. The failure may go unseen until someone checks the logs for something else. Infrastructure monitoring has shown that the agent ran, but has not checked whether it did the intended task. Availability and behavioral quality have diverged without triggering an investigation.
Most teams that run production LLM agents already have traces. What they lack is an engineered connection between those traces and the decision about what to ship next. Observability shows what the agent did, while a separate workflow decides what should change and why. When a failure is found, a person must make a judgment call without a decision based on the execution record that others can review.
McKinsey's State of AI trust in 2026 report lists a lack of trace-level visibility and quality measurement among the top reasons why agent rollouts stall. Monitoring alone does not close that gap. A trace can establish that a tool ran without showing whether its output was relevant, whether the prompt caused the wrong choice, or whether a proposed correction improves behavior. Eval scores, attribution, and replay validation are required to turn the record from expensive logging into a basis for release approval.
What a production trace actually contains and why the raw form is insufficient
A production trace is a directed acyclic graph of spans, with each span representing one unit of work. That unit may be an LLM call, a tool invocation, a retrieval step, a workflow step, or a sub-agent handoff. Each span records inputs, outputs, latency, token usage, and success or failure. The graph connects these operations into an execution record. Its structure explains what happened, but not necessarily what failed.
An agent response is not adequately described by a binary success or failure status because groundedness, relevance, and policy compliance can vary within the same run. Eval spans attach those scores to the execution record so that quality degradation can be located within the trace. Prompt version and tool schema version show which configuration was used so the result can be understood.
The maturity bar in 2026 brings six primitives together on the same span data, namely trace, span, metric, eval score, alert, and version. A single view then exposes the trace tree, eval score, prompt version, cost, latency, and alert status for a request. Most teams have not reached that bar. Even this richer record is still an observation rather than a reproducible test, because the same input does not always produce the same behavior. Temperature, retrieval results, and tool availability can change the execution path, so a ship decision requires more than inspecting one recorded run.
How agent failures actually distribute across the harness layers
Agent failures concentrate in the harness. The harness includes the memory, tool calling, workflow orchestration, retrieval, skill definitions, and evals that turn a model into a useful agent. AgentEval's 2026 failure taxonomy found that wrong tool selection caused 18% of failures in agent traces that people analyzed by hand. Treating every incorrect response as a model problem can direct the fix away from the layer responsible.
Tool schema drift illustrates how that misdirection happens. A version upgrade changes how tool schemas are generated, and the new output becomes incompatible with the LLM API. The resulting failure appears as wrong behavior without an exception, with tool calls potentially still returning HTTP 200 while producing incorrect or degraded results. A trace that records only technical success cannot show whether that happened or the tool interaction worked as it should.
Prompt ambiguity makes attribution hard in a different way because small flaws can cause large changes in behavior from one run to the next. The span containing the wrong output shows where the failure surfaced. A bad tool argument, for example, can originate in an ambiguous prompt two steps earlier. Location and cause are different engineering facts. Before a change is proposed, a structured root-cause taxonomy must link the symptom to the prompt, tool schema, workflow, or memory layer that caused it. Otherwise, a team can ship a technically valid modification that leaves the original failure unresolved.
Why span-based trace replay is the prerequisite for a verifiable fix
Attribution identifies where to intervene, but it does not establish that the intervention works. Simply rerunning the original request is insufficient because retrieval results, tool availability, and temperature can change the conditions that produced the failure. Span-based replay instead uses the recorded execution as the basis for validation, with sandboxed tool outputs and scorer runs making the comparison inspectable.
MLflow's 2026 LLM observability guide identifies span-based trace replay as a baseline requirement for production-grade observability. The requirement extends beyond reproducing the first troublesome request. Because a trace is one sample from a distribution of behaviors, validation must cover a historical set that represents the failure pattern. A fix may improve the triggering case while degrading a different input shape already present in the corpus. Testing only the first case leaves that regression outside the decision.
Eval gates turn the replay results into reviewable evidence. These automated scorers grade agent outputs against defined criteria and give before-and-after scores, so the assessment does not rest on a developer's impression. When policy violations rise detectably in a CI gate, the prescribed response is to revert the prompt change and add a gate rule that blocks recurrence. The trace supplies the evidence for the investigation, while replay tests the change and the gate enforces the result.
What the structured handoff artifact looks like when observability is built for it
The handoff artifact is a trace, or a cluster of traces, annotated with the information needed to judge a proposed change. It identifies the responsible harness layer, the specific modification, and the eval scores before and after that modification. It also contains the replay validation result against the historical trace set. Prompt version belongs in the same record. Without it, an evaluator cannot reliably connect a behavioral comparison to the prompt configuration being proposed.
The artifact serves the same purpose as code review. It makes the evidence inspectable, the scope auditable, and the validation reproducible by someone who was not present during the investigation. A reviewer can distinguish a tool schema correction from a prompt change and examine the corresponding quality results. This is more specific than a statement that an agent now performs better. It is a record of what changed, why that change addresses the attributed cause, and how the tested behavior compares with the baseline.
Runtime tracing and eval gates give that record operational force. A gate can block a regression from shipping or flag a live quality drop, so the artifact is not merely advisory documentation. MLflow's agent observability platform guide describes the improvement loop as using incoming traces to evaluate performance, optimize prompts, and monitor behavior. For that loop to support a release decision, eval and version data must remain attached to the same span data.
Risky traces become evaluation cases for CI and regression testing, so an investigation contributes more than a one-time correction. The change can still be reviewed, and how the fix works stays open to inspection.
How teams close the loop between agent monitoring and shipping better agents
Producing this handoff reliably requires instrumentation, scoring, attribution, and validation connected as stages of one workflow. Instrumentation captures every span type through telemetry-native auto-instrumentation, including LLM calls, tool calls, retrieval, sub-agent handoffs, and workflow steps. That captures the full execution graph without manual annotation for each call. The workflow begins with this coverage because later scoring and attribution depend on knowing how the run unfolded.
Scoring attaches eval spans at runtime rather than adding a separate quality assessment after the fact. Groundedness, task completion, and policy compliance scores then live on the same span data as the execution record. This is the step most teams skip. When a scored trace reveals a failure, attribution maps the symptom span to the responsible harness layer before a fix is proposed. Validation then replays that fix against historical traces that cover the failure pattern, and eval gates compare the result with the baseline.
Framework flexibility is structural because the ecosystem includes LangGraph, OpenAI Agents SDK, DSPy, Pydantic AI, and CrewAI, and it changes quickly. Instrumentation tied to one framework can require rebuilding the trace pipeline when the framework changes. Trace ownership is equally consequential because production records capture agent behavior and can contain sensitive information. A self-hosting path and an export guarantee therefore concern both compliance and control of a strategic asset.
With quality thresholds tied to the deployment pipeline, a prompt regression can block a release before it reaches production. The gate uses replay in place of live traffic, which keeps the cost of catching that regression low. The platform must connect tracing, evaluation, prompt optimization, and governance so their outputs work together beyond what side-by-side views can show. The practical test is whether the scored replay result reaches the ship decision as evidence the pipeline can act on.
The discipline that emerges when the handoff is treated as an engineering artifact
Harness engineering becomes a first-class responsibility when changes to prompts, tools, workflows, evals, and memory require inspectable evidence and validation before shipping. The process acquires the repeatability and auditability expected of other engineering work. Review no longer depends on reconstructing an investigation from someone's memory. Defined steps connect the production symptom, the attributed cause, the proposed intervention, and the result of testing it. That connection gives continual learning an operational form.
The harness is also where this discipline offers substantial leverage. Prompt changes, tool schema corrections, workflow restructuring, and memory updates are faster to ship, cheaper to validate, and more directly attributable than model-level changes. Trace-driven handoffs make that leverage visible by tying each intervention to observed behavior. Guesswork and manual log review do not provide the same basis for verification. Synthetic benchmarks alone also cannot show the actual distribution of production conditions, including those that no pre-deployment test suite planned for.
Production traces are therefore the most direct evidence available for improving agents under the conditions they actually face. Their value grows when failures feed forward into the evaluation corpus. Each added case expands the behavior that future gates can test, and each validated correction has a baseline against which later changes can be judged. As the trace corpus and gate coverage grow, treating observability as the handoff artifact makes agent improvement a more reliable, repeatable engineering cycle.