OpenTelemetry Instrumentation for Agent Regression Trace Capture
Capture tool arguments and results to detect silent failures in agent pipelines.
When a tool call inside a multi-agent orchestration pipeline fails silently, it is almost never the model that's at fault. It's a span that was never recording the tool's argument payload and result. If the only thing captured at the tool boundary is a name and a call ID, a tool that worked and a tool that quietly accepted a malformed write and discarded it look identical. Detecting silent tool failure requires instrumenting the full argument and result on every tool-call span, not just logging that the call happened, and this article lays out how that instrumentation is built using OpenTelemetry's GenAI conventions.
Why conventional APM instrumentation cannot see what breaks in an LLM agent
Standard application monitoring rests on three assumptions that hold for most backend services: a given input returns a consistent output, a failure appears as an exception or a timeout, and a stack trace points to the line of code that caused it. None of these hold for an LLM agent. The failure modes that matter most in agent systems, hallucination, context window overflow, a tool silently returning the wrong result, throw no exception and leave no stack trace. A single aggregate error rate cannot tell an engineer which step in a five-step agent chain is the one that broke, and without instrumentation built for agents, the actual cause stays buried. What's missing is structured, per-step trace data that records the state of the system at each decision point, not just whether the overall request succeeded.
What OpenTelemetry's GenAI semantic conventions capture
OpenTelemetry's GenAI Special Interest Group has defined a set of standard attribute names, prefixed gen_ai.*, so that LLM telemetry can move into any OTel-compatible backend without each team writing custom parsing logic to make sense of it. For every call to a language model, a span carries attributes that identify the model and summarize what it cost: gen_ai.request.model, gen_ai.usage.input_tokens, gen_ai.usage.output_tokens, and gen_ai.response.finish_reasons. These attributes currently hold Development stability status rather than Stable as of mid-2026, which matters for teams deciding how much to build on top of them before the spec settles further.
Prompt text and completion content live in span events instead of span attributes, and that distinction is a deliberate control point: events can be filtered or dropped entirely at the Collector level without touching a single line of application code, which is how teams manage PII exposure and compliance risk without re-instrumenting every service that calls an LLM. The event structure mirrors how a conversation actually unfolds. Earlier versions of the spec used separate per-message events, gen_ai.assistant.message and gen_ai.tool.message, but both were deprecated as of v1.37.0 in favor of the consolidated input/output message attributes. For agent workloads specifically, every tool call, every LLM invocation, and every retrieval step becomes its own child span, and strung together those spans produce a full, ordered trace of how the agent actually reasoned through a request, not just what it returned at the end.
The three-signal pipeline: traces, metrics, and logs working together
OpenTelemetry separates observability into three signal types, and for LLM workloads each one answers a different question.
The pipeline that ties these together has a simple shape: the application SDK generates telemetry, which flows to a telemetry collector, which forwards it to any backend that speaks the same standard protocol.
[ App + OTel SDK ] → [ OTel Collector ] → [ OTLP-compatible backend ]
spans,              redaction,              storage,
metrics,            enrichment,             analysis,
logs                routing                 alerting
The Collector is the one place in that chain where sensitive prompt content gets redacted, where spans are enriched with environment metadata, and where signals get routed to one or more destinations, all before any of it leaves the network boundary. Standardizing on gen_ai.* pays off here specifically because it makes the backend swappable: instrument an application once against the OpenTelemetry GenAI conventions, and the resulting spans will flow into any compatible backend without rewriting the instrumentation layer. Consider a retrieval-augmented generation pipeline as a concrete case. The attributes that matter here, temperature, top_p, model name, token counts, finish reason, differ from what a traditional service trace carries, because these particular parameters determine both what the system cost to run and whether the output was any good, in ways a plain HTTP status code never reveals.
Auto-instrumentation as the starting point
If you want baseline visibility into an LLM-based system fast, auto-instrumentation gets you there. Wrapping the OpenAI client with [OpenAIInstrumentor().instrument(capture_message_content=True)](https://uptrace.dev/blog/opentelemetry-ai-systems) produces model-call spans complete with token counts and finish reasons immediately, without touching the application's own logic. That's a real starting point, not a placeholder. But auto-instrumentation only sees what the SDK itself sees, which is the model API call. It has no visibility into a custom retrieval step written by the application team, no way to attach an evaluation score to a span, no insight into business logic that sits between two LLM calls, and no native way to represent a workflow that routes across multiple models.
So you close those gaps by writing manual spans by hand wherever auto-instrumentation goes dark. A tool call, for instance, should open its own span, tag it with gen_ai.tool.name and a call ID, and close it carrying the result and a status:
with tracer.start_as_current_span("tool_call") as span:
span.set_attribute("gen_ai.tool.name", "crm_update_contact")
span.set_attribute("gen_ai.tool.call.id", call_id)
span.set_attribute("tool.arguments", json.dumps(args))
result = crm_client.update_contact(**args)
span.set_attribute("tool.result", json.dumps(result))
span.set_status(Status(StatusCode.OK))
In an agent trace, that tool-call span needs to be a child of the LLM call span that requested it, so the resulting trace shows the actual reasoning chain as a connected structure.
Catching silent tool failure: three failure categories traces must distinguish
Production agent failures tend to fall into three categories, and each one needs different data on the span so you can diagnose it. Instrumentation decisions should be driven by which of these three a team actually needs to catch.
The first, and the one most likely to go unnoticed for weeks, is tool schema drift. A tool's input schema changes somewhere upstream, the agent keeps calling it with the old argument shape, and the tool accepts the call and silently drops the write without throwing an exception. Nothing in a conventional error-rate dashboard flags this, because nothing failed the way a conventional system understands failure. Catching it requires capturing the full argument payload and the result on every single tool-call span, not just the tool's name and call ID. This is the exact mechanism behind the question of how a multi-agent orchestration pipeline can return wrong answers with no errors in the logs: the tool call "succeeded" by every signal the harness was tracking, while silently discarding the work it was supposed to do.
The third is workflow loops and context failure: two agents (or one agent across turns) repeating the same action, drifting off the original goal, or losing track of the conversation. Catching this requires threading gen_ai.conversation.id through every span in the trace, so the full multi-turn trajectory is visible in one place, along with span timestamps to spot the repetition pattern.
A trace built from model-call spans alone, capturing only token counts and latency, can tell an engineer that a run was slow or expensive. It cannot tell them which of these three categories caused the wrong answer, because all three require data at the harness layer, not just the model layer. Without agent-aware instrumentation, a failed step is visible but the layer responsible for it, prompt, tool, workflow, or memory, stays hidden. Platforms like Moda are built on the premise that production traces carry this granular signal, ingesting them to attribute a given failure to the specific harness component responsible and propose a concrete fix.
Structuring spans so traces are replayable, not just observable
Observability and replayability solve different problems, and conflating them is a common mistake. A trace records what happened during a run. An evaluation framework can score whether the output was good or bad. Neither one, on its own, lets an engineer take a single component out of a recorded failing run, swap in a fix, and check whether that specific change resolves the failure while everything else about the run stays fixed.
Recent academic work formalizes exactly this gap. Chronicle (Chawla and Koul, arXiv:2609.20625, to appear at REALM @ EMNLP 2026) records agent runs at their non-deterministic boundaries, meaning model calls, tool calls, memory reads, as immutable envelopes, then replays a run from that record. Its central operation, cut-point replay, takes a chosen subset of those boundaries, runs new code live at them, and serves the rest of the run from the recorded envelope.
Getting there means treating every non-deterministic boundary, a model call, a tool call, a memory read, a retrieval, as a named, addressable span with its full inputs and outputs captured, not just a latency number and a status code. Span IDs and parent-child relationships need to stay stable across runs so a specific step in a recorded trace can be identified and swapped out during replay. Tool call arguments and results need to live on the span itself rather than in a separate log stream, so the boundary can actually be served from the record when cut-point replay needs it. Chronicle's published numbers back up the claim that this level of capture is cheap: recording overhead runs 23 microseconds per boundary crossing, and full replay issues zero model calls while staying bit-stable across 20 repetitions. Those figures come from an evaluation built on deterministic simulated boundaries, so if your agents depend on real-world tools that don't behave the same way twice, the core claim about replaying genuinely non-deterministic, live tool responses hasn't been validated yet for you. The instrumentation lesson holds regardless: build for replayability from the first span, treating every non-deterministic boundary as something to capture completely, not as an afterthought logged on the side.
Traces earn their value once they carry the exact prompt, parameters, tool calls, and reasoning chain behind a decision, since that is data a conventional span was never built to hold. That same structured, per-step record is what makes replay validation possible: a system built to analyze agent failures in production can take a broken run, replay it against a candidate fix, and confirm the fix actually works before it ships.
Span data required for each layer of the agent harness
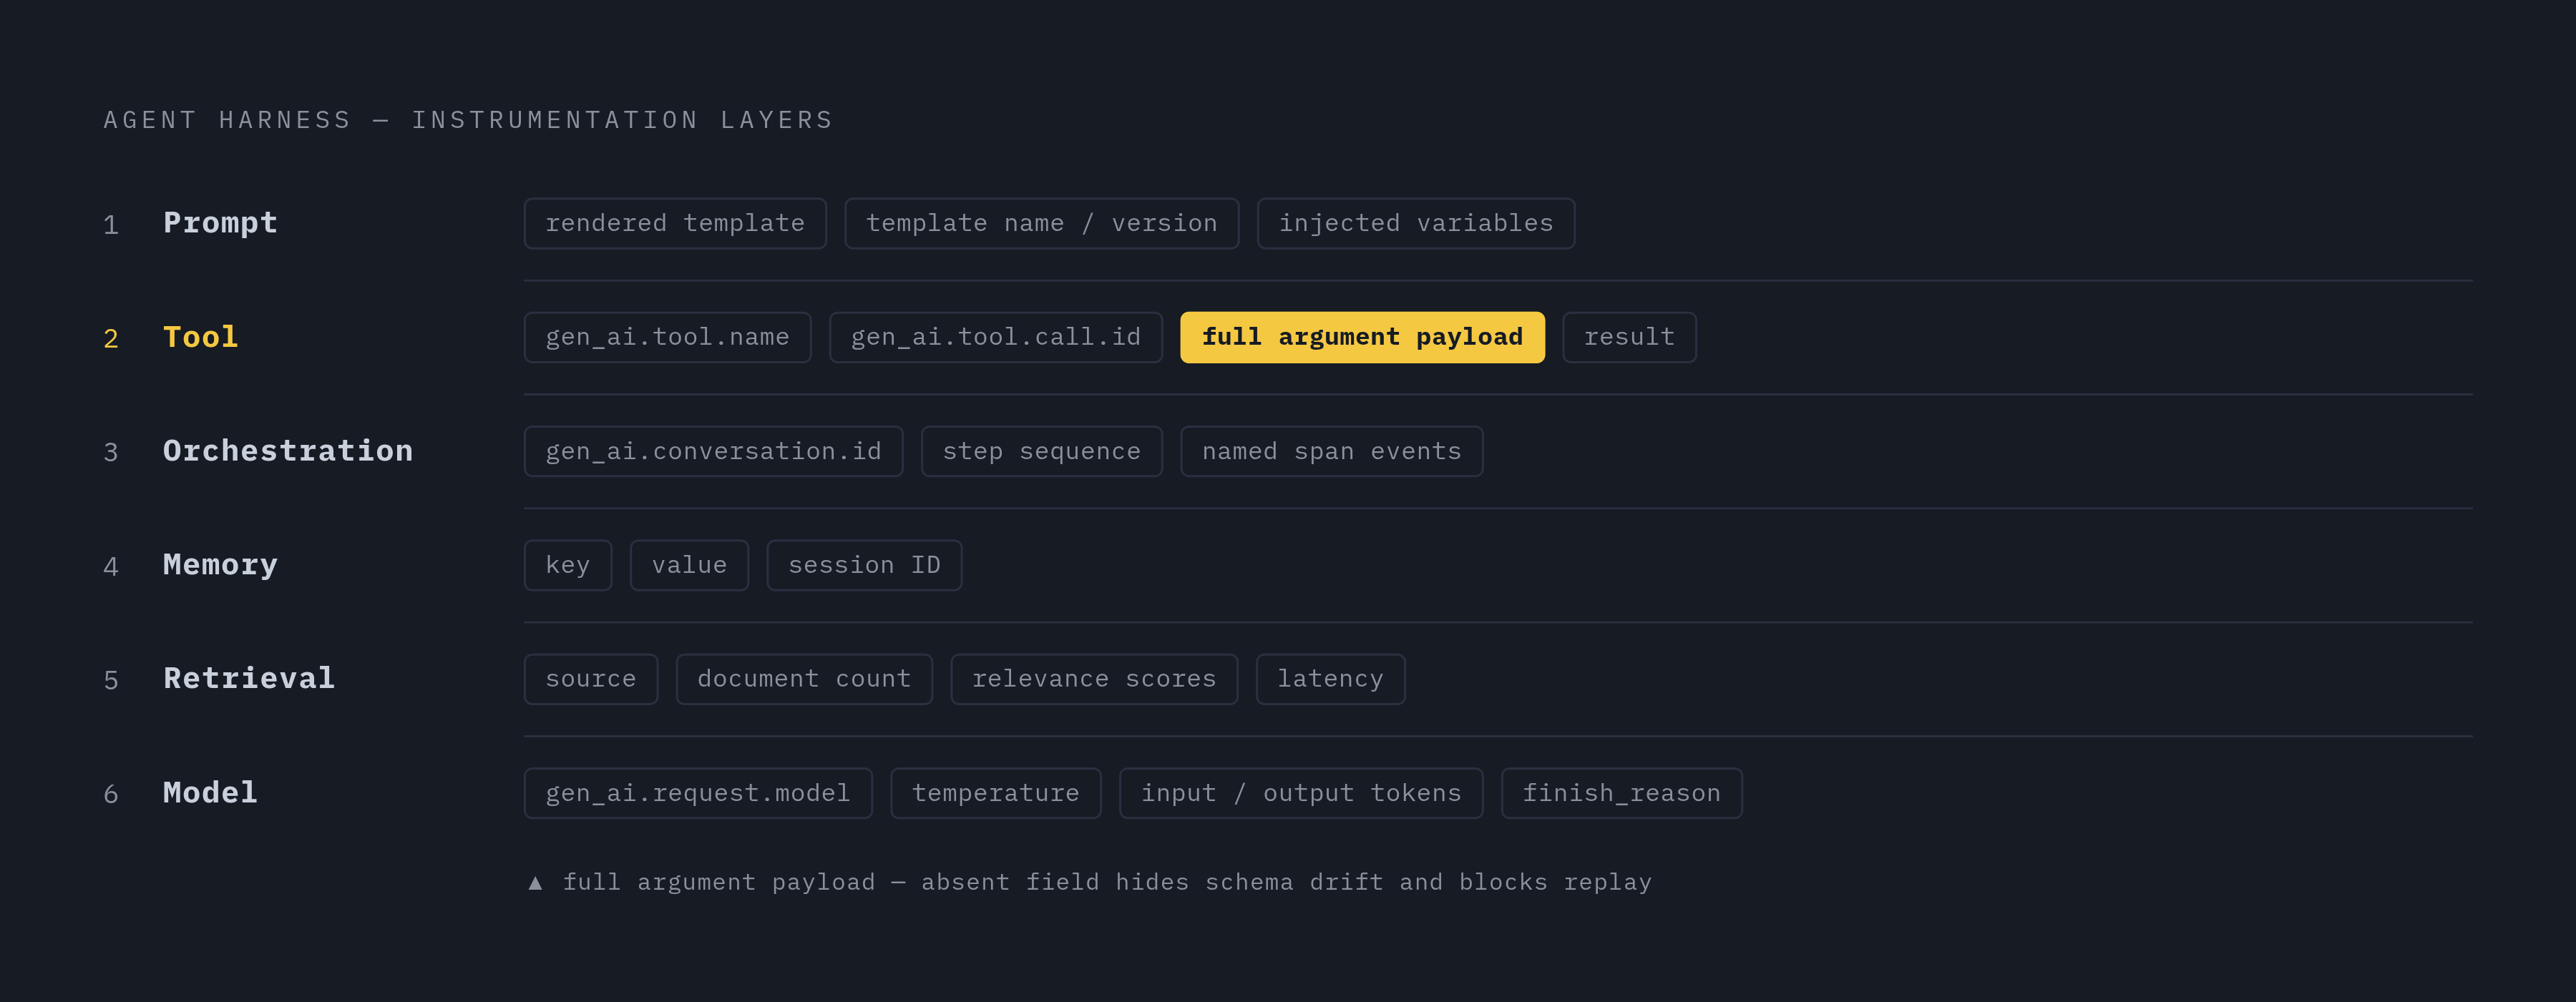
The agent harness breaks down into six layers that can each be instrumented separately, and each one needs its own kind of span data to support regression trace capture later. The prompt layer needs the rendered prompt template captured in a span event rather than an attribute, along with the template's name or version and whatever variables were injected into it, so that a regression caused by a prompt change can be told apart from a regression caused by the model itself behaving differently. The tool layer needs gen_ai.tool.name, gen_ai.tool.call.id, the full argument payload, and the result; without that argument payload, schema drift is invisible and the boundary can't be replayed. The workflow and orchestration layer needs gen_ai.conversation.id and the sequence of steps taken, with each orchestration decision, which branch got taken, what step came next, recorded as its own named span event so loop patterns are visible later. The memory layer needs reads and writes captured as child spans carrying the key, the value, and the session ID, because memory state that shifts between an original failure and a later re-run is one of the most common reasons a bug becomes impossible to reproduce. The retrieval layer needs the source, the document count, relevance scores, and latency recorded on the retrieval span itself, because those are the inputs that decide whether the model ever had the right context to work with. The model layer needs gen_ai.request.model, temperature, gen_ai.usage.input_tokens, gen_ai.usage.output_tokens, and gen_ai.response.finish_reasons present on every single call, not only the top-level one, which is the layer auto-instrumentation already covers reasonably well on its own.
ClawTrace illustrates why this granularity matters in practice: by instrumenting agent sessions at the level of individual LLM calls, tool use, and sub-agent spawns, including cost attribution at each step, it enables a kind of downstream failure analysis that a coarse, request-level trace simply can't support. Granularity at the tool and sub-agent boundary is the actual signal the rest of the analysis depends on, not overhead to be trimmed for performance.
Propagating trace context across service boundaries and multi-agent handoffs
Multi-agent systems rarely run inside a single process, and a trace that stops at a service boundary is a trace that can no longer answer the question it was built to answer. Standard W3C traceparent propagation, carried through every HTTP call between services, is what keeps a single logical request stitched together as it crosses from an orchestrator into a sub-agent, into a tool service, and back again. When an agent hands a task off to another agent, whether that's a sub-agent spawned mid-task or a separate service entirely, the gen_ai.conversation.id and the parent span context need to travel with that handoff, not get regenerated fresh on the other side. A new trace ID at the handoff boundary severs the very reasoning chain the rest of this instrumentation was built to preserve, turning one coherent multi-agent trajectory into several disconnected fragments that no longer show which upstream decision caused a downstream failure. Getting this right is what lets a trace explain what an entire multi-agent system actually did, beyond a single LLM call.